
PARA ORGANIZADORES DE EVENTOS
Digital al centímetro, imprimible hasta A0
Arrastra un escenario, dibuja un aparcamiento a escala, suelta una barra y una carpa. Cada objeto encaja en el mapa, cada superficie se mide automáticamente en metros cuadrados, cada ruta peatonal y de emergencia en metros. Sin CAD, sin Photoshop, sin formación.
El módulo de plano de evento es 100% gratis para todos. Sin paywall, sin prueba, sin flujo de registrarse-y-pagar. Más de 10.000 organizadores de eventos en toda Europa lo usan ya para su festival, desfile, feria o evento deportivo.
Crea tu cuenta gratis abajoa la derecha y empieza a dibujar ahora mismo. ¿Quieres hablar de una colaboración más estrecha, una alianza o la incorporación en bloque de un colectivo de eventos? Usa la segunda pestaña, «Hablar de colaboración».
“Dibujé el festival entero una tarde. Carpas, barras, escenarios, cada salida de emergencia.”
“No soy diseñadora. Recinto de 60.000 visitantes, solo navegador, cuarenta minutos.”
Crea una cuenta gratis y dibuja planos de eventos sin límite. Gratis para siempre, sin tarjeta.
El módulo de plano de evento es y seguirá siendo 100% gratis. Crea una cuenta y empieza a dibujar.
No solo los organizadores de eventos nos quieren:





Más de 10.000 profesionales del sector de eventos, infraestructura y ayuntamientos usan nuestro software a diario.
“Llevo usando Traffic Chart bastante tiempo y me encantó desde el primer día. Hace mi trabajo en producción de eventos mucho más sencillo.”
01 MÓDULO PLANO DE EVENTO
Digital al centímetro, imprimible hasta A0.
Abre el editor en cualquier navegador, mueve el mapa hasta el recinto y empieza a soltar objetos del catálogo: escenarios, tráileres, kioscos, barras, taquillas, vallas, baños. Cada elemento lleva sus medidas reales y aparece a escala en el mapa.
Dibuja tus zonas como polígono, rectángulo o círculo: aparcamiento, camping, zona de público, zona restringida, área de carpa, con metros cuadrados auto-calculados. Traza rutas peatonales, vehiculares y salidas de emergencia con metros auto-calculados. Exporta como PDF A4, A3, A2, A1 o A0 para tu ayuntamiento y los briefings en campo, o comparte la URL en vivo con tu equipo de seguridad para revisión en su navegador.
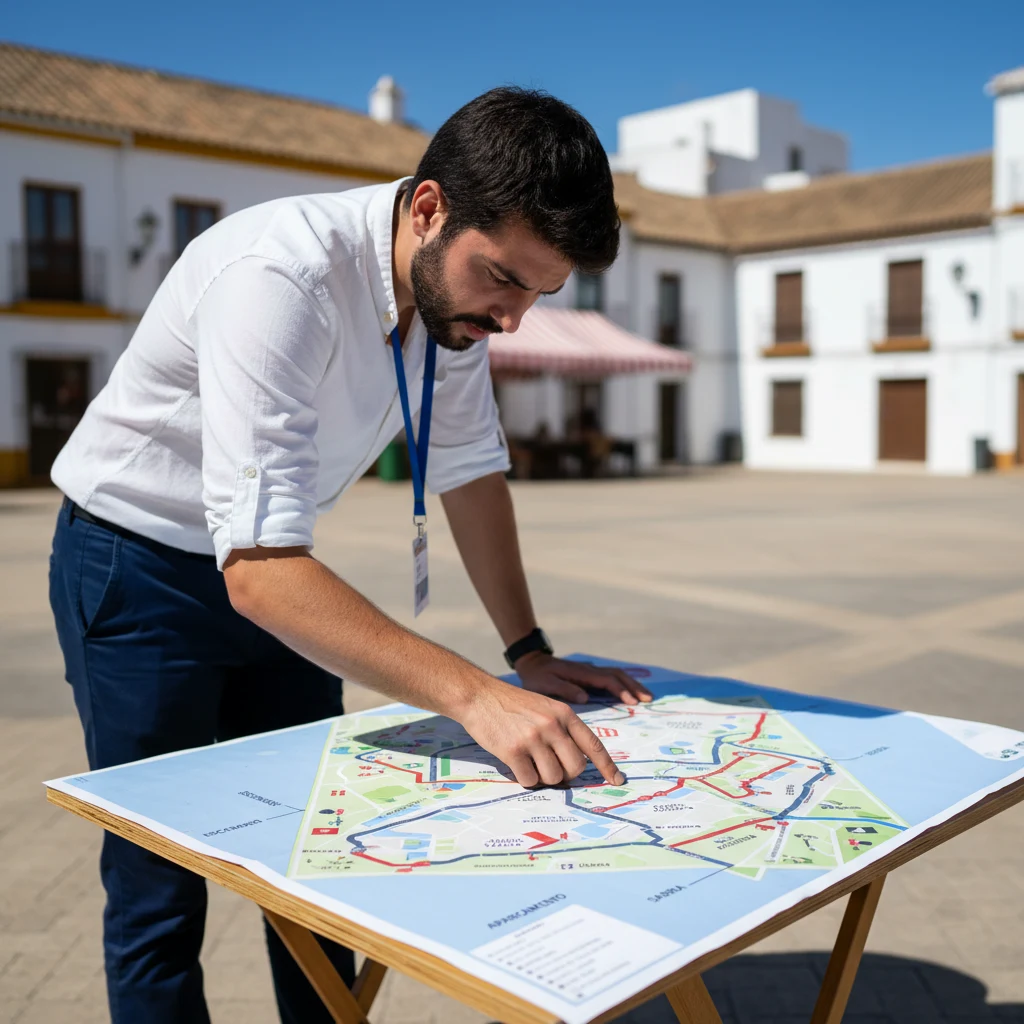
Cómo dibujas un plano de evento
Cuatro pasos desde un mapa en blanco hasta una PDF que tu ayuntamiento reconoce al primer vistazo.
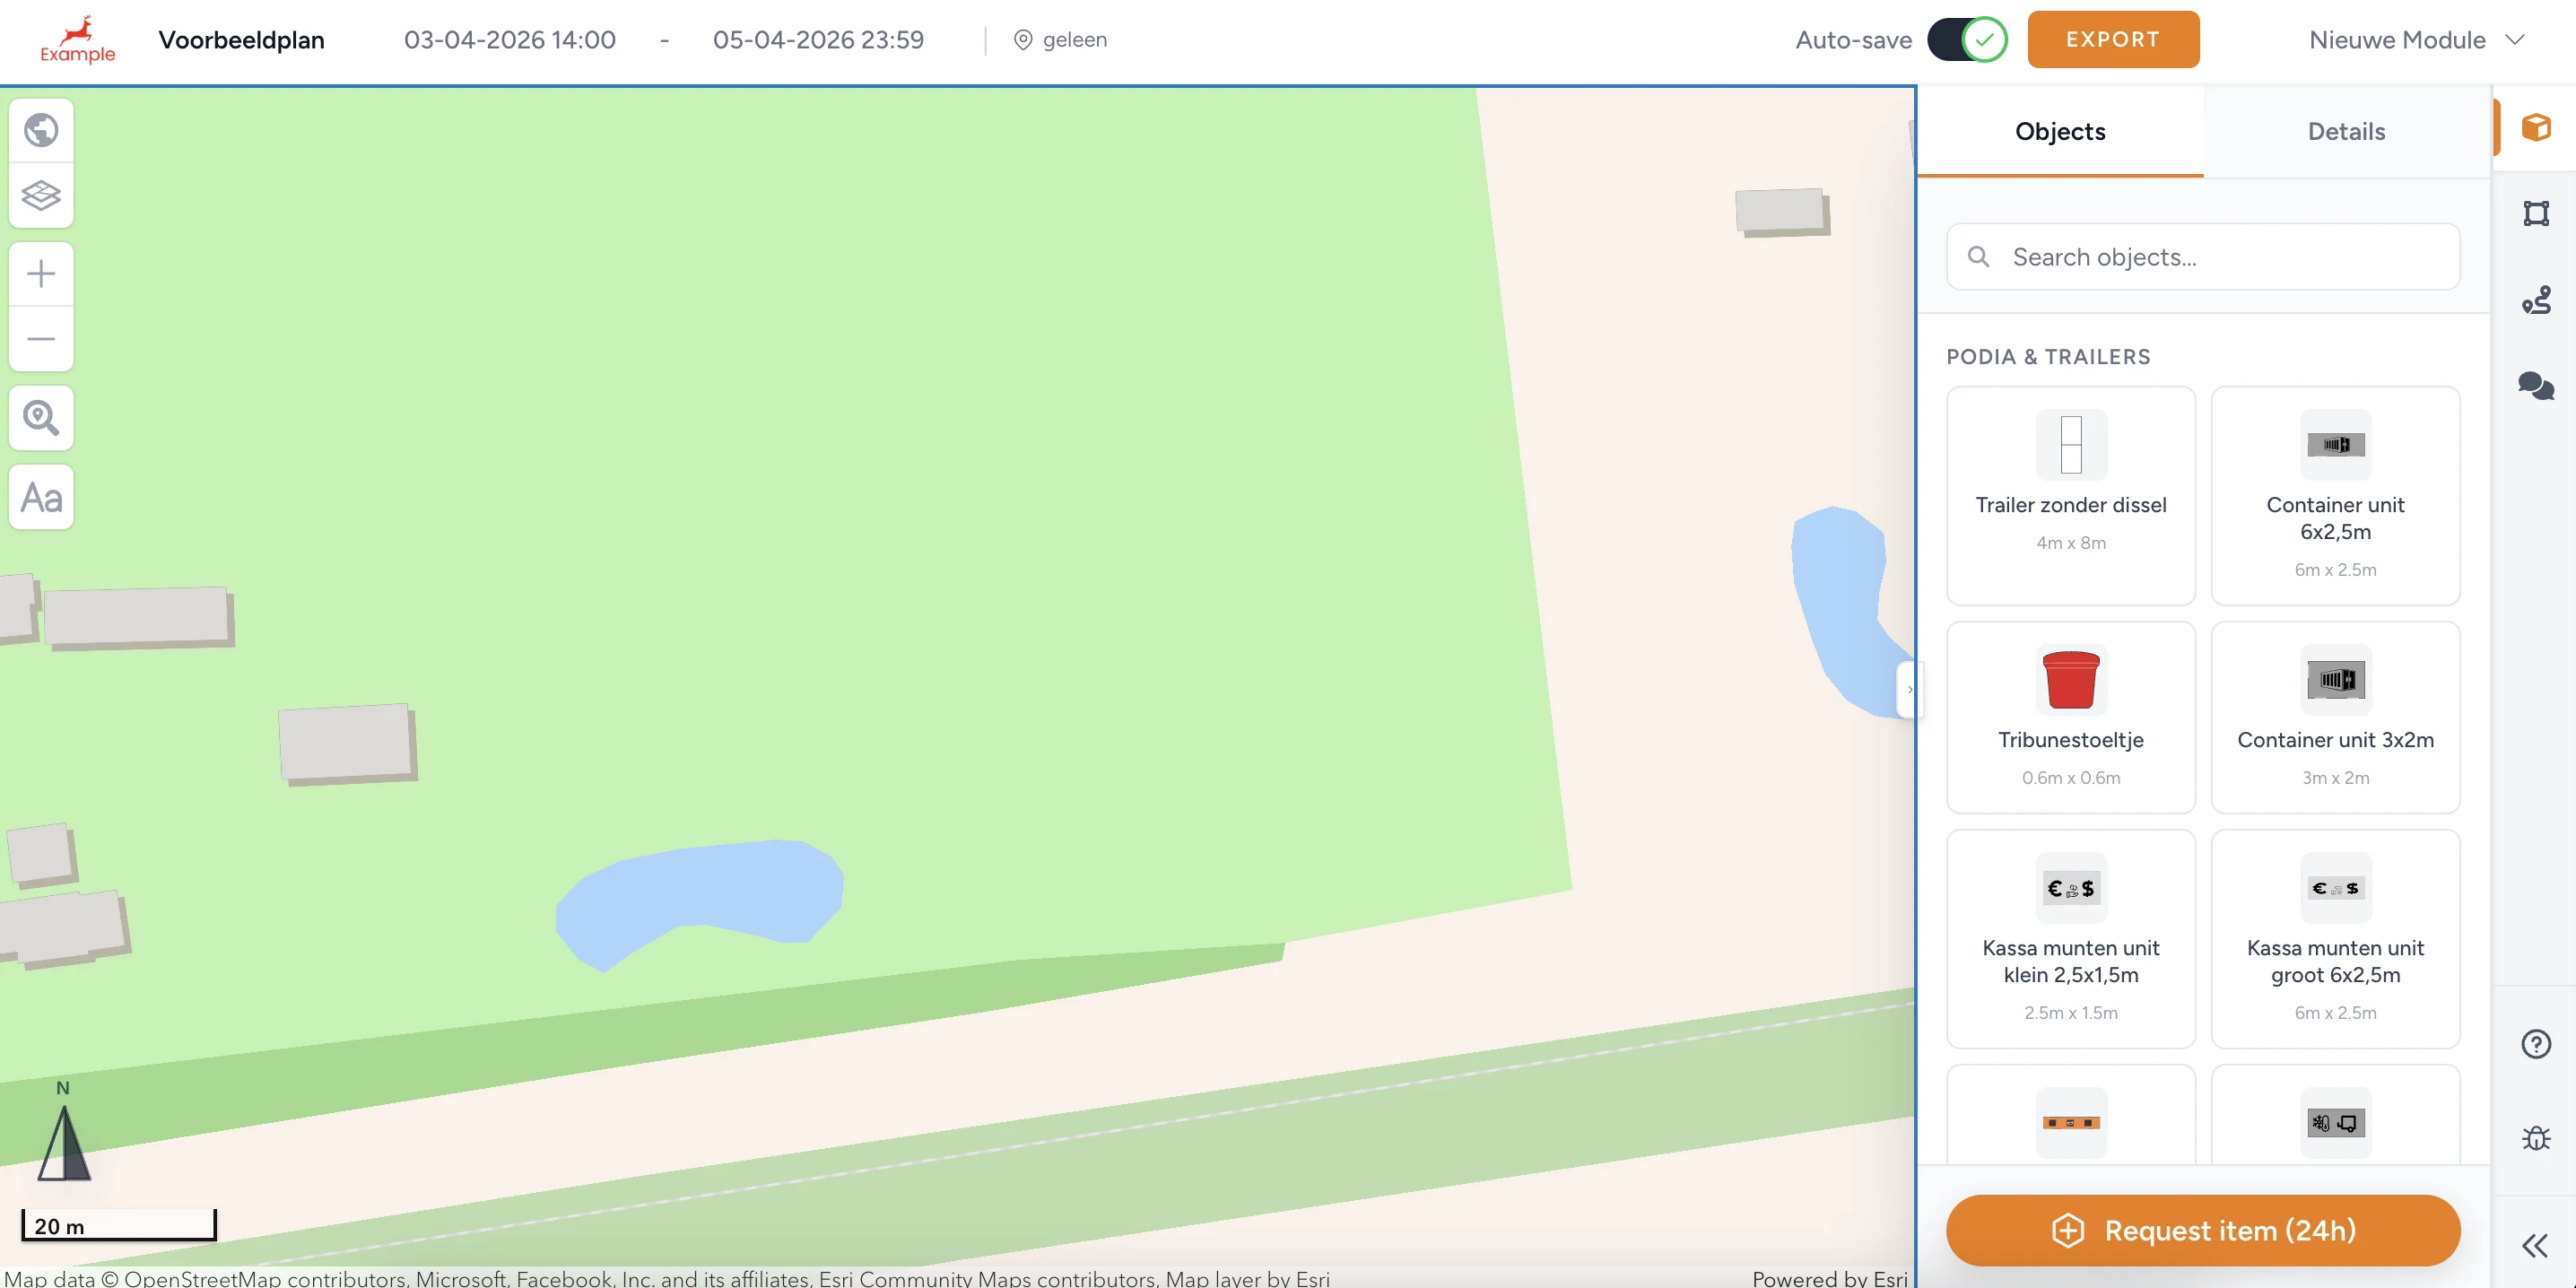
Arrastra objetos al mapa
Abre el editor y ves el recinto sobre el mapa. Navega por el catálogo: escenarios, tráileres, kioscos, taquillas, vallas, baños, y arrastra cualquier objeto al mapa. Cada uno lleva sus medidas reales y se dibuja a escala.
Funciones
- Catálogo drag-and-drop: escenarios, tráileres, kioscos, barras, taquillas, vallas, baños, todos con medidas reales
- Zonas poligonales, rectangulares y circulares, auto-medidas en m² (aparcamiento, camping, zona de público, carpas, restringidas)
- Seis tipos de ruta con longitud auto-medida: peatonal, vehicular, emergencia, acceso, límite, salida de emergencia
- Mapa con pan y zoom completo, sin necesidad de subir un plano del recinto
- Auto-guardado en cada cambio, nunca pierdes un trazado por una pestaña cerrada
- Soporte para eventos de varios días con marcas de inicio y fin por plan
- Exporta a PDF A3 / A4 para la solicitud de licencia, o comparte URL en vivo para revisión
- Lista de materiales auto-generada por plan (conos, vallas, recuento de señales listo para compra)
- Instrucciones de montaje auto-generadas para el equipo en campo, imprimibles por plan
- Formulario request-item: 24 horas de margen para añadir un objeto personalizado al catálogo
Beneficios
- 100% gratis para todos, sin paywall, sin prueba, sin flujo registrarse-y-pagar
- 90% más rápido para crear planos de evento que con CAD, Word, PDF o Photoshop
- Las solicitudes llegan en el formato que el ayuntamiento espera, al primer intento
- El equipo de seguridad revisa el mismo lienzo donde dibujas, sin rondas de PDF
- Las superficies y rutas auto-medidas quitan el factor adivinación de la planificación de aforo
- Solo navegador, sin instalación, sin licencia por equipo
- Sin formación en CAD ni Photoshop, tu equipo produce desde el primer día
02 TAMBIÉN INCLUIDO
¿Necesitas también un plan de tráfico? Misma área, misma base.
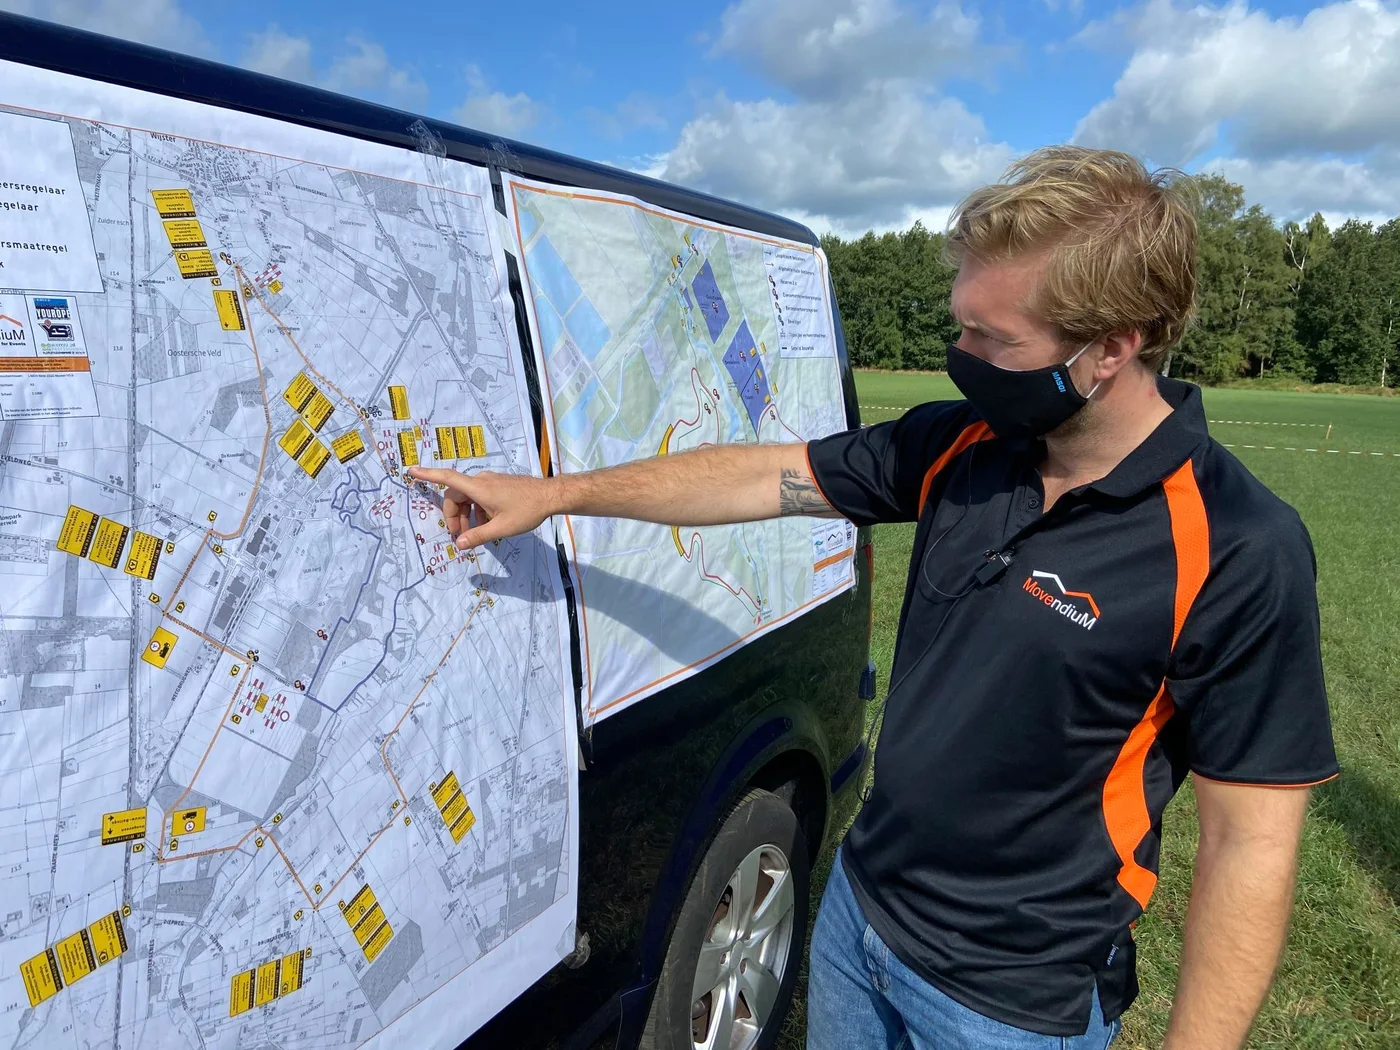
Si tu evento corta una calle, estrecha un carril, tiene una ruta de desfile o coloca señalización en vía pública, necesitas también un plan de tráfico. Traffic Chart ofrece el módulo de plan de tráfico junto al módulo de plano de evento. Al iniciar sesión eliges cuál vas a dibujar, y cada módulo tiene su propio lienzo y su propio catálogo: el plano del evento lleva objetos, zonas y rutas a escala; el plan de tráfico lleva el catálogo oficial de señales del país (DGT Norma 8.3-IC en España, RVV en los Países Bajos, StVO + RSA en Alemania, TSRGD + Chapter 8 en Reino Unido, IISR en Francia, Manual de Sinalização Temporária en Portugal).
Lo que conecta a los dos es la base de mapa compartida. Dibujas el lado del evento contra la misma base geográfica que usa el ingeniero de tráfico de tu ayuntamiento para el lado del plan de tráfico, así los dos planes encajan exactamente cuando llegan a su bandeja. También puedes superponer uno sobre el otro en el navegador para detectar conflictos (por ejemplo, una ruta peatonal que cruza una zona de calle cortada) antes de entregar.
¿LISTO PARA DIBUJAR?
¿Trabajas en algo mayor que un solo evento?!
¿Colectivo de festivales, pool municipal de eventos, o una plataforma que quiere integrar planos? Cuéntanos tu setup; pensamos contigo en partnership, integración o onboarding en bloque. El formulario en la parte superior de la página es para eso.
FAQ, organizadores de eventos
Preguntas habituales de organizadores de festivales, desfiles y eventos comunitarios antes de dibujar su primer plano.